|
"ALGORISMES GENÈTICS" |
Objectius de la pràctica:
1. Els algorismes genètics: la modelització de levolució
En aquesta pràctica anem a optimitzar tres problemes:2. Optimització (minimització o maximització de funcions)Maximitzem the function F = x10 , xÎ [0, 1] Trobem el mínim de la funció banana (re: bandemo.m) Trobem el punt màxim duna "modification of peaks".
Anem a minimitzar la següent funció (Aquest exemple sha près de Goldberg, capítol 3).F = x10 , xÎ [0, 1]
2.1) Invoquem els genetics utilitzant una expressió amb largument fun
options = foptions([1 1e-3]); (valors per defecte per a rutines doptimització) Crida ara la funció dalgorismes genètics genetic de la següent manera
options(13) = 0.03; (probabilitat de mutació)
options(14) = 50; (número màxim de generacions per defecte)
vlb = 0; (valor mím de lespai de cerca)
vub = 1; (valor màxim de lespai de cerca)
bits = 30; (número de bits a codificar els gens)
[x, stats, options, bf, fgen, lgen] = genetic('x^10', [ ], options, vlb, vub, bits);
El resultat de la recerca hauria de dir en pantalla:
Unes quantes notes a tenir en compte:Primer, vegem que x retorna un valor entre 0 i 1
x
x =
0.9956També que les generacions inicial i final, anomenades fgen and lgen, són valors reals tipus float entre 0 i 1
fgen
fgen =
0.2401
0.0939
0.3375
0.5127
0.2234
0.0378
0.5646
0.7907
0.0508
0.6054
0.4258
0.4939
0.6780
0.6507
0.1528
0.6993
0.9806
0.5604
0.3069
0.1639
0.9326
0.1913
0.4552
0.9873
0.0703
0.7209
0.8499
0.6773
0.3427
0.9772El nombre total de cops que la funció dadaptació ha estat avaluada és igual a ((number of generations)+1)*size_pop . Recordem que la població inicial també requereix davaluacions del a funció size_pop).
En aquest exemple, la funció dadaptació ha esta cridada num_fit_call = (options(10)+1)*options(11) nombre de pics.
num_fit_call = 180
Això vol dir 180 vegades.
2.2) Invoquem el AG (algorisme genètic) usant el M-file testgen.m
Vegem que la funció ha estat codificada com una string binària on no és necessari donar bits com a arguments.vlb = zeros(1,30);
vub = ones(1,30);
[x1, st1, options, bf1, fg1, lg1] = genetic('testgen', [ ], options, vlb, vub);
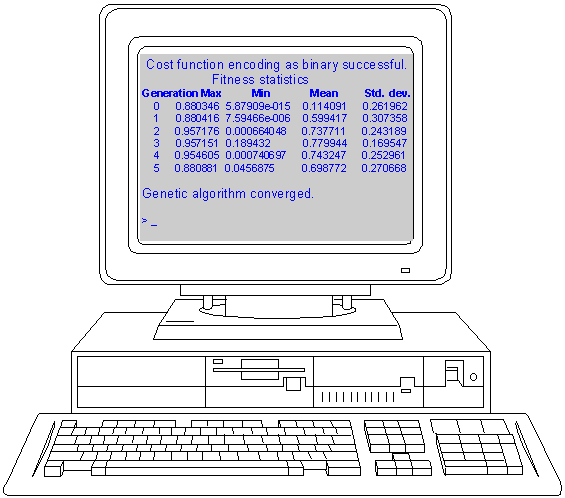
Fitness statisticsGenerationMaximumMinimumMeanStd. dev.
0 0.633478 8.56205e-019 0.0686593 0.150431
1 0.659757 0.0000111705 0.343871 0.203939
2 0.668303 0.0000473355 0.345461 0.222967
3 0.906711 0.0000960009 0.4697 0.232651
4 0.668313 0.000392362 0.463083 0.235904
5 0.668316 0.0000867559 0.53173 0.212893
6 0.915569 0.000405144 0.561946 0.225043
7 0.990345 0.0204098 0.600124 0.199701
8 0.990347 0.000419658 0.578974 0.26589
9 0.920089 0.0243143 0.558346 0.237115
10 0.981908 0.000939173 0.583995 0.241419
11 0.920161 0.000381 0.566384 0.252254
12 0.911067 0.029594 0.525635 0.219835
13 0.942994 0.0000439818 0.521836 0.263454
14 0.882845 0.165803 0.642498 0.139505
15 0.884995 0.000492249 0.617903 0.217519
16 0.920638 0.0197394 0.656164 0.209363Genetic algorithm converged.
Noteu que la resposta (x1) i les poblacions inicial i final (fg1 and lg1) es retornen com a cadenes binàries.3. Comparació amb mètodes basats en gradientx1 =
Columns 1 through 12
1 1 1 1 1 1 1 1 1 1 0 0Columns 13 through 24
0 0 0 0 0 1 1 1 0 1 1 1Columns 25 through 30
0 0 0 0 0 1size(fg1)
ans =
30 30
Aquestes cadenes es poden decodificar usant decode.m
x1d = decode(x1,0,1,size(vlb,2))
x1d =
0.9990
fg1d = decode(fg1,0,1,size(vlb,2))
fg1d =
0.2539
0.5968
0.3653
0.6545
0.8673
0.1145
0.1568
0.9554
0.4228
0.8965
0.2745
0.1148
0.2408
0.4376
0.1357
0.1322
0.8886
0.1141
0.5032
0.0156
0.8197
0.2898
0.5901
0.7082
0.8962
0.0655
0.6514
0.1650
0.2397
0.0207
Ara estudiem la funció banana ques pot veure a bandemo.mLa funció banana és:

I lobjectiu és trobar un mínim de la funció en el domini x(1)Î [-2, 2] and x(2)Î [-1, 3].
Primer esmentem un parell de detalls. Com que lAG maximitzarà una funció, per fer una minimització facem, set FUN = - f. També, com que genetic.m està implementada de forma que espera que la funció dadaptació sigui sempre positiva aleshores una constant ha de ser sumada. Així la funció a optimitzar queda finalment:
f = '1000 - (100*(x(2)-x(1))^2 + (1-x(1))^2)'
Cost function encoding as binary successful.
Fitness statistics
GenerationMaximumMinimumMeanStd. dev
0 979.014 -516.715 718.598 349.88
1 998.962 -289.73 771.887 291.485
2 999.372 50.6384 795.058 242.669
3 999.982 45.5336 839.171 246.304
4 996.612 60.8993 819.883 236.203
5 999.264 369.93 896.263 160.069
6 997.281 272.806 873.195 170.649
7 998.808 316.596 848.389 173.831
8 989.729 308.695 835.306 176.835
9 999.27 -297.328 783.504 269.156
10 999.047 270.001 900.874 143.467
11 999.798 370.968 875.116 155.654
12 993.737 239.502 814.657 184.366
13 995.665 409.418 840.839 136.289
14 995.667 649.027 865.567 118.149
15 996.204 600.715 865.108 114.807
16 998.268 148.709 876.894 166.522
17 999.605 421.746 860.487 150.47
18 998.799 301.755 874.132 170.12
19 995.655 -263.151 770.599 298.638
20 993.445 556.058 874.627 129.325
21 999.634 373.262 923.079 126.808
22 999.652 466.697 918.819 125.974
23 999.766 489.903 887.138 144.503
24 994.581 417.257 863.398 152.432
25 994.165 426.233 844.188 155.896
26 998.374 284.41 844.521 200.158
27 998.897 434.629 869.232 135.781
28 998.894 435.52 870.688 145.611
29 999.316 435.462 903.396 158.83
30 999.857 18.148 913.987 194.349
31 999.856 543.875 930.465 104.27
32 999.879 -87.3772 885.879 227.395
33 999.88 387.368 864.155 193.937
34 999.875 312.609 881.401 184.77
35 999.6 398.56 849.167 192.332
36 999.694 -67.8893 828.833 251.807
37 999.685 295.896 889.272 185.067
38 999.396 -150.398 889.77 224.115
39 998.469 249.261 895.035 182.646
40 999.274 415.936 899.96 175.965
41 999.592 420.816 886.967 168.424
42 999.313 315.062 846.95 194.381
43 999.49 50.0983 826.331 232.683
44 999.425 219.412 780.686 228.225
45 999.32 286.891 869.544 148.721
46 999.276 259.618 859.322 166.037
47 999.566 633.324 921.593 87.2732
48 999.277 8.27092 852.547 207.674
49 999.776 194.418 881.967 183.685
50 999.606 483.355 886.18 138.081
51 999.682 141.165 853.233 180.543
52 998.313 -7.09712 832.715 210.083
53 998.625 215.018 855.719 182.739
54 999.35 458.987 860.662 138.647
55 999.49 458.987 837.358 143.186
56 999.578 -473.633 771.702 348.264
57 999.415 275.135 864.64 187.706
58 999.394 308.257 906.883 166.497
59 999.041 676.317 925.988 85.3448
60 999.588 318.743 889.415 156.013
61 999.589 237.637 833.145 200.368
62 997.765 11.3218 840.935 215.634
63 998.886 501.934 844.291 134.2
64 998.328 504.67 878.553 136.421
65 998.947 486.505 878.672 124.552
66 990.567 454.04 853.278 156.516
67 998.765 400.344 874.432 156.323
68 999.951 488.466 871.758 134.429
69 999.616 505.824 882.443 129.505
70 997.532 108.961 785.235 239.62
71 990.548 502.318 815.603 153.87
72 996.258 571.047 826.203 144.228
73 999.598 273.692 872.18 158.859
74 999.177 496.841 856.633 131.752
75 998.598 301.882 856.471 168.578
76 999.887 235.708 844.155 201.033
77 999.88 -217.001 850.024 252.607
78 999.886 297.197 869.956 163.033
79 999.35 295.877 863.227 163.874
80 999.789 -762.04 820.01 327.889
81 999.645 -51.0228 846.658 213.456
82 998.858 137.187 889.059 177.231
83 997.827 532.165 902.578 130.126
84 997.593 494.765 885.289 152.51
85 999.706 -789.682 783.437 437.557
86 999.716 -405.666 808.352 330.762
87 999.421 549.148 936.002 110.409
88 998.977 595.083 950.627 83.6499
89 999.531 658.432 942.575 91.2401
90 999.742 439.622 893.537 141.216
91 999.792 -6.71898 838.582 229.771
92 998.942 434.954 867.931 165.393
93 998.446 -489.082 798.011 332.472
94 999.099 436.098 892.625 171.515
95 999.217 402.59 877.402 170.431
96 999.74 413.359 854.427 161.441
97 999.784 -557.452 792.959 380.388
98 999.738 -497.994 827.899 314.695
99 999.867 385.275 888.162 173.271
100 998.024 574.736 931.188 106.748Maximum number of generations reached without termination criterion met. Either increase maximum generations or ease termination iterion.
El que probablement has vist és que lAG ha convergit ràpidament (en unes quantes generacions) dins duna regió a prop del ínim de la funció.% El millor rendiment (fitness o adaptació) és al punt
x =
1.1238 1.1292
Ara considera que lAG ha creat 30 generations de 30 individus cada una, així que shan fet 31*30=930 avaluacions de la funció dadaptació. Compara aquest amb els resultats de tècniques basades en gradient del fitxer bandemo.mSi els algorismes genètics no han convergit, que podem fer?
Notem quels AG estan millor dotats per determinar les regions on un màxim global hi pot existir. Un cop trobades les regions doncs fora millor aplicar-hi tècniques doptimització més clàssiques (eines de càlcul gradient com el hill climbing).
Per exemple, considera el problema de determinar el pic més alt a una regió amb múltiples pics. Es pot descriure tal regió de forma matemàtica mitjançant una adaptació de lequació que genera els pics. Específicament, considera una equació de la forma:
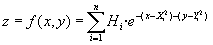
Si n fós 1, aquesta podria ser lequació duna colina simètrica amb un pic dalçada H centrat al punt (X, Y). Es pot fer la colina asimètrica aplicant-hi contants multiplicatives als termes de lexponent. Perfils de colines més complicats es poden crear fent H = H(x,y). Per a més informació escriu help peaks.
A tall dexemple per ara evitarem aquestes complicacions. Tinguent n colines de diferents alçades i emplaçades a prop entre elles, en resulta un topologia suficientment interessant. Mirem laspecte de 10 colines generades a latzar dins del rang 0<x<6 i el rang 0<y<6. Les alçades se han de forma aleatòria definit entre 10 i 20.
Nota: Si exp és un vector columna, trasposant H llavors loperació H*exp es podrà fer.
En aquest punt faràs un plot de la funció. Nota quels paràmetres addicionals sanomenen referred P1...P10 al programa genetic.m X = 6*rand(10,1);
Y = 6*rand(10,1);
H = 10*rand(1,10) + 10;
P1 = X;
P2 = Y;
P3 = H;f = P3*exp(-(x(1)-P1).^2 -(x(2)-P2).^2)
pts = 0:0.05:6;
x_y = ones(length(pts),1)*pts;Per aconseguir a les valls qualque probabilitat de reproduir-se:
z = 5*ones(size(x_y));
for i=1:10,
z = z + H(i)*exp(-(x_y-X(i)).^2 -(x_y'-Y(i)).^2);
end
hold offVisualitzem la funció a optimitzar
contour(x_y,x_y',z)
surf(x_y,x_y',z);
hold onEt sembla un problema fàcil de resoldre? Finalment cridem a lalgorisme genètic:
Vegeu com les matrius X, Y i H són passades com a arguments addicionals
vlb = [0 0];
vub = [6 6];
options = foptions(1);
options(13) = 0.0333;
bits = [16 16];
[x,stats,options,bf,fg,lg] = genetic(f,[],options,vlb,vub,bits,X,Y,H);Cost function encoding as binary successful.
Fitness statistics
Gen. MaximumMinimumMeanStd. dev
0 38.112 0.000062521 11.2901 11.6547
1 38.0194 0.000661045 19.3763 12.9602
2 41.7311 0.000453457 19.1949 14.6355
3 40.764 0.0800356 23.7633 13.2441
4 40.6764 0.000696383 22.8414 13.8821
5 40.635 0.00330611 21.4394 16.0317
6 41.5516 0.0490717 28.6056 12.9985
7 41.3666 11.1238 29.5386 10.6943
8 41.8883 3.37647 35.1395 9.21269
9 41.286 11.9428 32.9428 9.36465
10 41.0941 0.0146367 30.6427 12.1353
11 41.0668 7.43024 31.7426 10.9973
12 41.0137 0.0236603 29.9239 12.4857
13 41.3076 10.5753 33.1569 9.87751
14 41.7804 0.05104 29.4797 14.0366
15 41.4817 0.193334 29.7848 12.0064
16 41.5868 4.56804 31.2029 11.0826
17 41.5868 7.12753 30.5353 11.7181
18 41.6843 10.6608 28.609 11.2958
19 41.3305 5.92245 28.7455 12.4865
20 40.0938 12.4607 33.2285 7.62956
21 40.993 0.157023 31.5637 11.4964
22 40.8061 9.87571 33.2532 8.18381
23 41.7245 0.185536 31.483 11.6551
24 39.739 0.189314 29.2947 11.6558
25 39.4754 0.0112304 29.0128 10.503
26 39.5333 0.19343 28.9018 11.0156
27 39.5248 12.3584 28.9518 9.202
28 39.1556 5.78882 27.401 10.266
29 39.6211 0.00486602 28.8795 11.0762
30 41.1398 8.14323 28.4796 9.40814
31 39.2526 0.631843 26.4276 10.713
32 39.0596 3.77302 28.8476 10.3717
33 39.0596 8.97629 26.4833 10.0896
34 38.8211 0.307357 27.7991 11.2917
35 38.8133 0.671352 29.9086 9.1873
36 39.2325 0.0179949 29.2245 10.8184
37 39.2325 0.993373 29.2475 10.488
38 39.1093 0.0324196 26.4084 11.7596
39 39.2928 0.435142 27.8129 11.19
40 39.4643 0.296502 32.0222 9.31248
41 39.4643 0.261284 31.1987 10.8009
42 39.3484 0.199207 33.3292 8.00173
43 39.396 3.29029 31.1703 10.4814
44 39.3871 0.232366 32.2946 10.9557
45 39.321 0.22553 30.7895 10.0392
46 38.7593 0.233291 27.5801 11.9253
47 39.3448 0.034088 27.5679 10.8568
48 39.3328 1.24666 26.6453 11.9761
49 38.4218 0.255489 28.7168 10.0077
50 40.8625 7.44979 29.2143 8.56587
51 41.5966 12.0919 29.1821 8.92818
52 41.7561 0.170536 27.1426 13.6042
53 41.6477 0.184345 26.6505 14.5531
54 41.7522 0.19054 26.2418 13.3026
55 41.5306 0.848772 27.3699 12.2441
56 41.4504 11.1202 31.6582 9.64205
57 41.5872 3.78818 30.7163 10.5157
58 41.6312 0.0348065 29.075 13.5032
59 41.8809 6.32504 31.2735 11.7605
60 40.6337 0.412089 28.9681 12.8007
61 40.7615 5.93702 28.6476 12.4585
62 40.7618 0.00723241 28.2205 11.5879
63 42.0515 0.032913 29.9575 11.4873
64 42.0482 6.39161 28.5048 11.4366
65 40.525 0.161536 27.1032 13.3109
66 40.5255 7.57523 28.0151 11.0054
67 40.525 7.8461 30.5575 9.52532
68 40.5285 2.07161 25.7258 11.6617
69 39.5717 5.43875 23.0496 11.7029
70 42.2131 7.77904 27.0774 11.9312
71 39.1305 0.0014061 28.2813 11.7859
72 39.6784 3.35861 30.0705 11.0563
73 39.7625 0.523619 29.6046 11.3973
74 39.7581 0.136893 27.4531 12.0859
75 39.7651 0.00260573 28.8022 12.9278
76 39.808 0.175586 27.6507 13.5331
77 39.8239 0.191154 32.0133 10.5275
78 39.8282 0.161418 30.4636 11.6937
79 39.7292 6.17274 30.9604 9.0596
80 39.8037 0.262364 31.0053 10.1595
81 39.8542 0.3299 26.0922 13.738
82 39.7964 0.237548 28.5282 10.6394
83 39.7964 6.92901 28.9195 9.82389
84 39.5616 6.38111 28.4284 10.3173
85 39.415 0.114795 27.3954 11.3744
86 39.5103 0.176789 27.8929 10.441
87 38.1739 0.012777 23.8982 12.0923
88 41.5625 0.206695 26.4359 12.13
89 41.4308 0.264695 25.1995 10.5743
90 41.4235 0.616564 27.6793 10.1471
91 39.392 0.271414 25.9168 11.8474
92 38.0481 13.7152 28.0114 7.34805
93 39.4706 0.157221 27.1457 11.4666
94 41.8673 1.27845 30.1197 9.68778
95 36.688 0.085877 25.5983 10.6374
96 36.2863 0.00739778 25.6727 9.13356
97 38.134 0.139032 26.5602 9.52286
98 39.4343 2.48601 27.983 10.8223
99 39.367 0.764348 24.0807 12.4576
100 38.8403 0.00123161 25.3373 10.4579Maximum number of generations reached without termination criterion met. Either increase maximum generations or ease termination citerion.
El punt màxim que ha trobat lalgorisme genètic és:
bf =
42.2131
Que es troba a:
x =
4.2271 4.8182
Compara aquest amb el maxim punt de la malla dibuixada:
[i,j] = find(max(max(z))==z);
z(i,j)
ans =
47.2230Ques troba a:
0.05*[i j]
ans = 4.2500
Exercici: Dissenyar una població genètica que intenti capturar el mateix coneixement que amb la pràctica de la xarxa neuronal on ensenyavem a un futbolista a decidir on anar.
EL FITXER DE LA DEMO ÉS
% This script demonstrates the use of the simple genetic algorithm
% rountine genetic.m
% Remark: How genetic might be improved
% Remark:
% Remark: More options for selection, crossover, and mutation schemes
% Remark: e.g. better scaling (no super-individual dominance)
% Remark: no self-mating
% Remark: reproduction handle non-positive fitness
% Remark:
% Remark: Optimize code for speed
% Remark:
% Remark: Better visualization
% Remark:
% Remark: Support continuous mutation
% Remark:
% Remark: Provide ability to alter (enhance) each child via
% Remark: local hill climbing
% Remark:
echo on
% So far, I've attempted three problems
% 1.) maximizing the function f(x)=x^10 0<x<1
% 2.) finding the minimum of the banana function (re: bandemo.m)
% 3.) finding the hightest point of a modification of peaks
% First consider the function
% f = x^10, 0<x<1
%
% This example is taken from Goldberg, Chapter 3.
% To find the maximum of this function within the given range,
% you may call genetic one of three ways.
%
% 1.) with the expression fun='x^10'
% 2.) calling the M-file fun.m (which does not exist) in which the
% fitness function is not encoded. The function would say simply
% function f = fun.m(x)
% f = x^10;
% 3.) calling the M-file testgen (which does exist) in which the
% fitness function has already been encoded
% First invoke genetic using an expression for the argument fun
options = foptions([1 1e-3]);
options(13) = 0.03;
options(14) = 50;
vlb = 0;
vub = 1;
bits = 30;
pause % Hit any key to continue
[x,stats,options,bf,fgen,lgen] = genetic('x^10',[],options,vlb,vub,bits);
% A few notes:
% First notice that x is returned as a real between 0 and 1
x
pause % Hit any key to continue
% Also the initial and final generations, fgen and lgen, are
% returned as reals between 0 and 1
fgen
pause % Hit any key to continue
% The total number of times the fitness function was evaluated is
% equal to the ((number of generations)+1)*size_pop
% re: initial population also requires size_pop function evaluations
%
% In the present case, the fitness function was called
num_fit_call = (options(10)+1)*options(11)
pause % Hit any key to continue
% Now envoke the genetic algorithm using the encoded M-file testgen.m
% Notice since the function has already been encoded as a binary
% string there is no need to supply a bits argument.
vlb = zeros(1,30);
vub = ones(1,30);
[x1,st1,options,bf1,fg1,lg1] = genetic('testgen',[],options,vlb,vub);
% Now notice that the answer (x1) and the initial and final
% populations (fg1 and lg1) are returned as a binary strings
x1
size(fg1)
pause % Hit any key to continue
% These may be decoded using decode.m
x1d = decode(x1,0,1,size(vlb,2))
fg1d = decode(fg1,0,1,size(vlb,2))
pause % Hit any key to continue
% Now consider the banana function explored in bandemo.m
% This example will probably (GA's are probabilistic) show
% that although the simple genetic algorithm is good at finding
% the region in which a global minimum (maximum) might exist,
% it does not possess the convergence properties of calcluls
% based techniques once it near the minimum (maximum).
%
% First recall that the banana function equation is
% f(x) = 100*(x(2)-x(1))^2 + (1-x(1))^2
% and that the goal is to find a minimum of the function
% in the range -2<x(1)<2 and -1<x(2)<3.
%
%First a couple details. Since genetic will maximize a function,
% to do a minimization, set FUN=-f. Also, since genetic.m
% (presently - this may change) expects the fitness function to
% always evaluate positive, a constant must be added. Thus
f='1000 - (100*(x(2)-x(1))^2 + (1-x(1))^2)'
% Recall too the contour plot of the banana function.
%
% << Please be patient while the contour plot is generated. >>
%
figure
xx = [-:0.125:2];
yy = [-1:0.125:3];
[x,y]=meshgrid(xx,yy) ;
meshd = 100.*(y-x.*x).^2 + (1-x).^2;
conts = exp(3:20);
contour(xx,yy,meshd,conts)
hold on
xlabel('x1')
ylabel('x2')
title('Minimization of the Banana function')
plot(1,1,'o')
text(1.1,1,'Solution')
% We encode x(1) and x(2) to have 16 bits each
bits = [16 16];
vlb = [-2 -1];
vub = [2 3];
options = foptions([1 -1]);
options(13) = 0.0333;
pause % Hit any key to continue
[x,stats,options,bf,fgen,lgen] = genetic(f,[],options,vlb,vub,bits);
% What you probably just saw was that the genetic algorithm
% quickly (within a couple generations) settled into a region
% near the minimum of the function.
%
% The present best fitness is at
x
% Now consider that the genetic algorithm has created 30 generations
% each of population size 30, thus calling for 31*30=930
% function evaluations. Compare this to the results of the
% calulus based techniques found in bandemo.
pause % Hit any key to continue
% So, if GAs aren't good at converging, what CAN they do?
% Well, they are supposed to be better able to determine a
% region where a global maximum might exist for functions
% which might otherwise mislead a more classical (calculus
% based, hill climbing) optimization technique.
%
% Consider for example the problem of determining the highest
% peak in a region with multiple hills. One might describe such
% a region mathematically via an adaptation of the equation which
% generates peaks. Specifically, consider an equation of the form
%
% n
% ___ 2 2
% \ - (x-X ) - (y-Y )
% \ i i
% z = f(x,y) = / H e
% / i
% ---
% i=1
%
% If n were one, this would be the equation of a single symmetric
% hill with a peak of height H centered at (X,Y). One could make
% the hill nonsymmetric by sprinkling multiplicative constants in
% the exponent terms. More complicated hill landscapes could be
% created by making H=H(x,y). For more information type help peaks.
%
% For the present, we avoid such complications. By merely having
% n hills of different heights close enough, a fairly interesting
% topology should be created. Let's see what ten randomly generated
% hills in the range 0<x<6 and 0<y<6 look like. Also define the Hi's
% to be randomly distributed between 10 and 20.
pause % Hit any key to continue
%
% << If exp is column vector, making H a row vector allows H*exp >>
%
X = 6*rand(10,1);
Y = 6*rand(10,1);
H = 10*rand(1,10) + 10;
P1 = X;
P2 = Y;
P3 = H;
% Show a surface plot of the function
% Note additional parameters are referred to as P1...P10 in genetic.m
f = 'P3*exp(-(x(1)-P1).^2 -(x(2)-P2).^2)'
pts = 0:0.05:6;
x_y = ones(length(pts),1)*pts;
% To give valley points some probability of reproducing
z = 5*ones(size(x_y));
for i=1:10,
z = z + H(i)*exp(-(x_y-X(i)).^2 -(x_y'-Y(i)).^2);
end
hold off
contour(x_y,x_y',z)
pause % Hit any key to continue
surf(x_y,x_y',z);
hold on
% Does this look like a tough problem?
% Finally, let's call the genetic algorithm.
% Notice how the matrices X,Y, and H are passed as additional arguments
vlb = [0 0];
vub = [6 6];
options = foptions(1);
options(13) = 0.0333;
bits = [16 16];
pause % Hit any key to continue
[x,stats,options,bf,fg,lg] = genetic(f,[],options,vlb,vub,bits,X,Y,H);
% The highest point found by the genetic algorithm is
bf
% Which is found at
x
% Compare this to the highest point on the grid
[i,j] = find(max(max(z))==z);
z(i,j)
% Which is found at
0.05*[i j]
% close
echo off
% end gendemo